
📊 MTR (My Traceroute) Tool
Combined ping and traceroute analysis
Waiting for input...
Network Tools
MTR Traceroute Online: The Ultimate Real-Time Network Diagnostic Tool
In today’s interconnected world, quickly diagnosing network connectivity issues is crucial for maintaining optimal performance. If you’re looking for a more powerful solution than traditional ping and traceroute commands, mtr traceroute online is the tool you need. This comprehensive guide will walk you through everything about MTR (My Traceroute) and how to use it effectively for network troubleshooting.
What is My Traceroute (MTR)?
MTR (My Traceroute) is a powerful network diagnostic tool that combines the functionality of both ping and traceroute into a single, comprehensive interface. Unlike traditional tools that provide static snapshots, MTR performs real-time route monitoring, continuously sending packets and displaying detailed statistics about each hop along the data path.
Developed by Matt Kimball in 1997, this advanced diagnostic tool has become the gold standard for network diagnostics thanks to its ability to provide continuous and accurate information about:
- Packet loss at each intermediate point
- Real-time latency measurements
- Jitter (ping variation over time)
- Detailed routing paths with comprehensive statistics
Why MTR Outperforms Traditional Ping and Traceroute
1. Continuous Monitoring vs One-Time Snapshots
- Ping: Only checks connectivity to the final destination
- Traceroute: Shows the route path once
- MTR: Continuously monitors every hop with cumulative statistics
2. Immediate Problem Detection
MTR allows you to instantly identify:
- Which points along the path have high packet loss
- Which routers are causing significant delays
- When network conditions return to normal
3. Intuitive Visual Interface
Instead of parsing difficult-to-read text output, MTR displays data in clear tabular format with columns for Loss%, Average, Best, and Worst latency metrics.
When Should You Use MTR Traceroute Online?
Network Problem Diagnosis
- Website loading slowly or timing out
- Online gaming experiencing unexplained lag
- VPN connections being unstable
- Email sending/receiving delays
Routine Monitoring
- Checking connection quality to servers
- Monitoring ISP performance
- Evaluating optimal CDN endpoints
Professional Troubleshooting
- Identifying bottlenecks in network infrastructure
- Separating local vs remote issues
- Providing evidence to ISPs when filing complaints
How to Use MTR Traceroute Online
Step 1: Access the Tool
Navigate to the mtr traceroute online tool in your browser – no software installation required.
Step 2: Enter Your Target
- Domain names: google.com, facebook.com
- IP addresses: 8.8.8.8, 1.1.1.1
- Server addresses: your-website.com
Step 3: Configure Parameters
- Packet count: 10-100 packets (default: 50)
- Interval: 1-5 seconds between packets
- Packet size: 32-1500 bytes
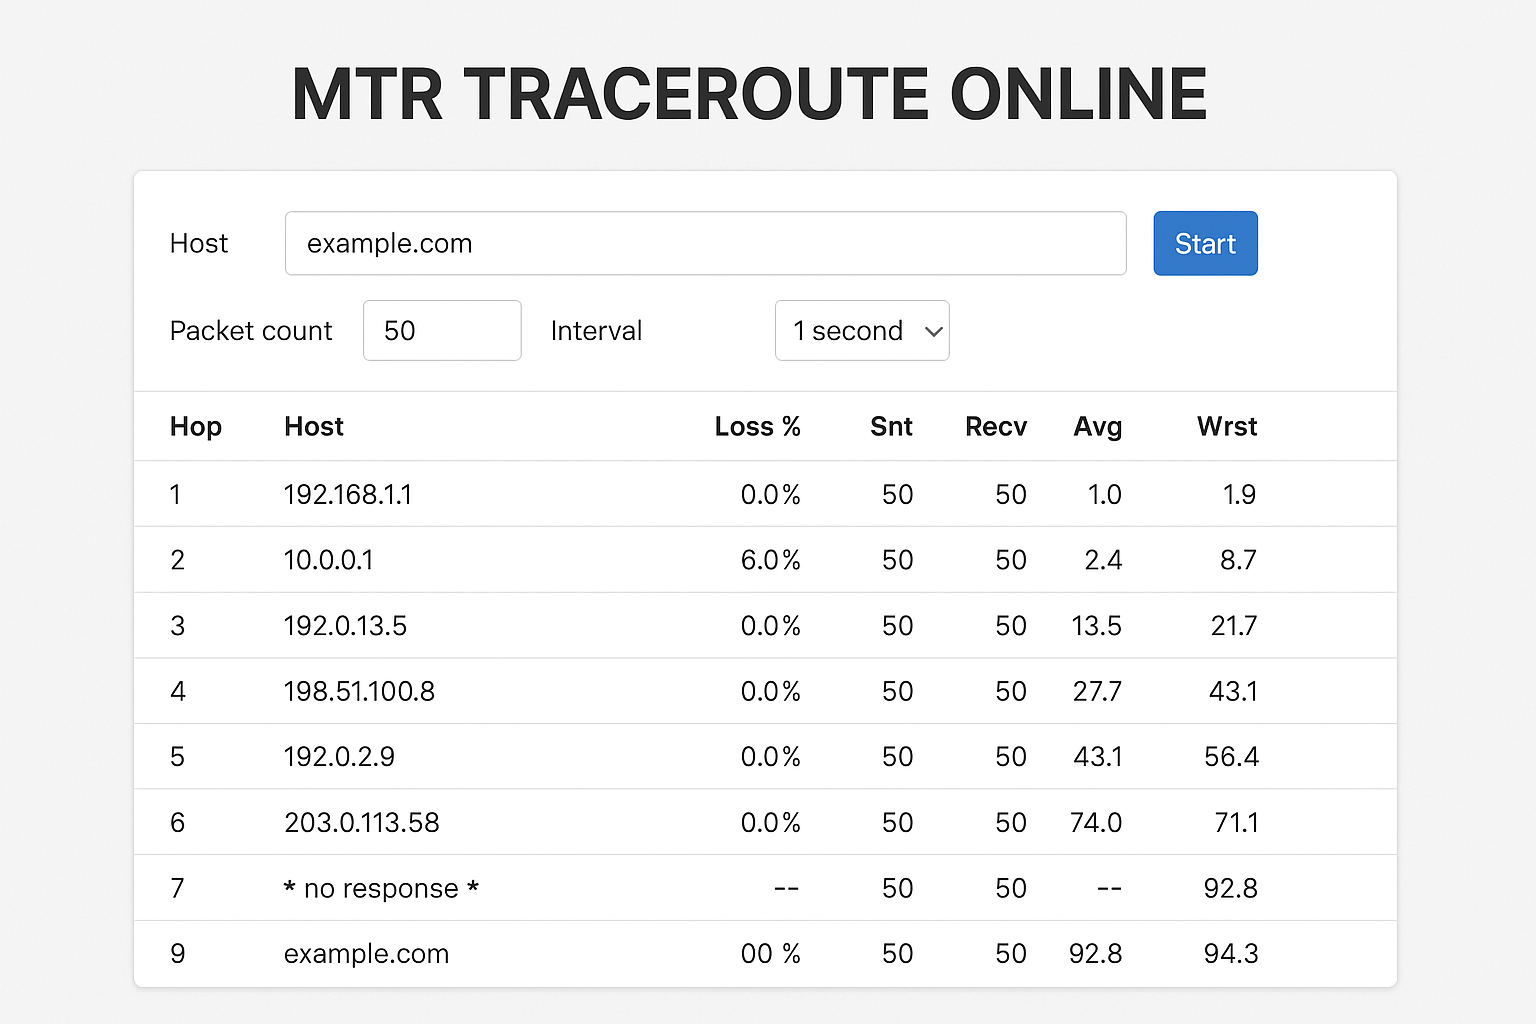
Step 4: Analyze Results
Hop  Host               Loss%  Sent  Recv  Avg   Best  Worst
1    192.168.1.1        0.0%   50    50    1.2   0.8   3.4
2    10.0.0.1          2.0%   50    49    15.6  12.1  45.2
3    isp-gateway.com   0.0%   50    50    25.8  20.5  38.9
Column Explanations:
- Loss%: Percentage of packets lost
- Avg: Average ping time
- Best/Worst: Best and worst ping times recorded
- Sent/Recv: Number of packets sent and received
Detailed Comparison: MTR vs Ping vs Traceroute
| Criteria | Ping | Traceroute | MTR |
|---|---|---|---|
| Intermediate hop info | ❌ | ✅ | ✅ |
| Continuous monitoring | ❌ | ❌ | ✅ |
| Packet loss detection | End-point only | ❌ | Every hop |
| Detailed statistics | Basic | ❌ | Comprehensive |
| Ease of use | ✅ | ⚠️ | ✅ |
When to Use Each Tool?
Use Ping Tool when:
- Quick basic connectivity checks
- Simple response time testing
- Basic uptime/downtime monitoring
Use Traceroute Tool when:
- One-time route path visualization
- Understanding network topology
- Checking routing policies
Use MTR when:
- Complex network problem diagnosis needed
- Continuous performance monitoring required
- Identifying specific bottleneck points
Real-World Example: Diagnosing Network Lag
Scenario: Severe online gaming lag
Step 1: Run MTR to game server
mtr game-server.com
Analysis Results:
Hop  Host                    Loss%  Avg
1    router.local           0.0%   1.2ms
2    isp-local.com          0.0%   15.6ms
3    isp-backbone.com       8.5%   45.2ms  ← Problem identified here
4    game-cdn.com           8.5%   89.6ms
5    game-server.com        8.5%   156.2ms
Analysis: Hop 3 (ISP backbone) shows 8.5% packet loss, which is the root cause of gaming lag.
Solutions:
- Contact ISP with MTR evidence
- Try changing DNS to 8.8.8.8 or 1.1.1.1
- Use VPN to bypass ISP routing issues
You can also combine this with TCP Ping Tool to test connectivity to specific game server ports.
Advanced MTR Troubleshooting
Identifying Packet Loss Patterns
Intermittent Loss: Loss% varies continuously
- Cause: Network congestion
- Solution: Test during different hours
Consistent Loss: Stable high Loss%
- Cause: Hardware/configuration issues
- Solution: Contact network administrator
Sudden Spikes: Abrupt Loss% increase at specific hop
- Cause: Router overload/failure
- Solution: Wait for recovery or find alternative routes
Analyzing Latency Patterns
Uniformly High Latency: All hops show elevated values
- Network-wide congestion
- ISP throttling issues
Latency Spikes at Specific Hops:
- Router processing delays
- Large geographic distances
Best Practices for Using MTR
1. Choose Appropriate Packet Counts
- Quick tests: 10-20 packets
- Regular monitoring: 50-100 packets
- Deep analysis: 200+ packets
2. Test from Multiple Points
- Test from local machine
- Test from different VPS/cloud servers
- Compare results to isolate issues
3. Combine with Other Tools
- Use IP Lookup Tool to identify router locations
- Run bandwidth tests to measure throughput
- Perform DNS lookups to check resolution times
4. Document Your Results
- Screenshot MTR outputs
- Record test timestamps
- Note network conditions (peak hours, weather events)
Frequently Asked Questions (FAQ)
Q: Is MTR more accurate than ping?
A: Yes, MTR is more accurate because it tests continuously and provides aggregate statistics. Ping only gives snapshots at specific moments.
Q: Why do some hops show “???” or timeouts?
A: Some routers are configured not to respond to ICMP requests or rate-limit responses. This doesn’t necessarily indicate problems.
Q: What Loss% indicates a problem?
A:
- 0-1%: Excellent
- 1-3%: Good (acceptable for most applications)
- 3-5%: Fair (may affect real-time applications)
- >5%: Poor (requires investigation)
Q: How does MTR online differ from command-line MTR?
A: Core functionality is identical, but online versions offer convenience without installation requirements and provide intuitive GUI interfaces. You can learn more about MTR’s technical specifications in the official documentation.
Q: Can MTR test IPv6 connections?
A: Yes, most modern MTR tools support IPv6. Simply enter an IPv6 address in the target field.
Q: Does MTR consume significant bandwidth?
A: Minimal usage. Default 32-byte packets at 1-second intervals result in negligible bandwidth consumption.
Advanced MTR Techniques
Continuous Monitoring Setup
For 24/7 monitoring, you can:
- Schedule periodic MTR tests
- Set threshold alerts for loss% and latency
- Log results for trend analysis
Geolocation Analysis
Combine MTR with IP geolocation to:
- Visualize traffic paths on maps
- Identify optimal CDN endpoints
- Plan network optimization strategies
Load Balancing Verification
Use MTR to verify:
- Round-robin DNS functionality
- Load balancer health checks
- Failover mechanism effectiveness
Integration with Network Monitoring Stack
MTR works exceptionally well when integrated with other network diagnostic tools. Consider combining network diagnostic tool mtr results with:
- Bandwidth testing to correlate speed issues with routing problems
- DNS resolution testing to identify DNS-related delays
- Port connectivity testing using specialized tools
- Geographic IP analysis to understand routing efficiency
This comprehensive approach ensures you get the complete picture of your network performance and can make informed decisions about optimization strategies.
Conclusion: MTR – An Indispensable Network Tool
MTR (My Traceroute) has proven itself as an superior tool in every network administrator’s and power user’s toolkit. With its real-time route monitoring capabilities and detailed packet loss analysis, MTR helps you:
✅ Quickly diagnose complex network issues
✅ Precisely identify bottleneck locations
✅ Provide evidence when working with ISPs
✅ Continuously monitor connection quality
Compared to simple ping commands or one-way traceroute, my traceroute mtr tool delivers comprehensive insights and actionable data that enable effective network performance optimization.
Whether you’re troubleshooting intermittent connectivity issues, monitoring server performance, or conducting detailed network analysis, MTR provides the depth and accuracy needed for professional-grade network diagnostics.
Try our MTR Traceroute Online tool now to visualize real-time packet loss and latency across your network path — no install required. Experience the power of this advanced network diagnostic tool mtr and elevate your network troubleshooting capabilities today!