
🛤️ Traceroute Diagnostic Tool
Trace network path to destination
Waiting for input...
Network Tools
Traceroute Tool: Complete Network Path Analysis Guide
In the complex architecture of Internet networking, tracking packet paths from source to destination hosts is essential for network administrators and system engineers. Traceroute is a critical diagnostic tool in network troubleshooting, enabling comprehensive mapping of the entire path that packets traverse through network topology. This isn’t just a simple traceroute tool, but an indispensable instrument for network performance analysis and routing behavior assessment in modern network management.
Traceroute Protocol and Network Layer Analysis
Traceroute is a network diagnostic utility operating at Network Layer (Layer 3) of the OSI model, utilizing ICMP (Internet Control Message Protocol) to trace routing paths through intermediate routers in network infrastructure. When performing a traceroute test, this tool maps each hop (routing node) in the end-to-end path, providing crucial information about network latency and routing topology.
How Does Traceroute Work?
Traceroute implementation is based on TTL (Time To Live) field manipulation in IP headers and ICMP error message handling:
- TTL Field Exploitation: Traceroute sends a sequence of UDP/ICMP packets with incrementally increasing TTL values starting from 1, 2, 3…
- Router Response Mechanism: Each router in the path decrements the TTL counter; when TTL = 0, the router drops the packet and sends an ICMP Time Exceeded message back to the source
- IP Address Extraction: From ICMP responses, traceroute extracts the IP address of intermediate routers at corresponding hops
- Iterative Process: The iteration continues with increasing TTL until reaching the destination host or maximum hop limit
Platform-Specific Implementation Analysis
Windows Traceroute Implementation
Windows traceroute (tracert.exe) implements ICMP-based tracing with specific technical characteristics:
tracert -h 64 -w 5000 google.com
Traceroute on Windows technical specifications:
- Protocol: ICMP Echo Request packets (Type 8)
- Maximum Hops: Default 30 hops (configurable with -h parameter)
- Timeout: 5 seconds default (-w parameter adjusts timeout)
- Packet Size: 32 bytes default payload
Linux Traceroute Advanced Configuration
Linux traceroute provides comprehensive protocol options and advanced tuning parameters:
traceroute -I -m 64 -q 3 -w 3 google.com
Linux implementation features:
- Multi-Protocol Support: UDP (default), ICMP (-I), TCP (-T)
- Query Control: Multiple queries per hop (-q parameter)
- Packet Customization: Size manipulation (-s), source port selection
- Advanced Options: AS number lookup, geographic mapping integration
macOS Traceroute Implementation
How to traceroute on Mac with BSD-based implementation:
traceroute -P UDP -p 33434 -m 30 google.com
Traceroute Mac technical characteristics:
- Default Protocol: UDP with destination port 33434
- Port Incrementation: Automatic port increment per probe
- IPv6 Support: Native IPv6 tracing (traceroute6)
- Integration: Network Utility GUI wrapper available
Traceroute Online: Cloud-Based Network Analysis
Traceroute online is an excellent solution when you need:
- Cross-platform accessibility without software installation
- Multi-location testing from various geographic points
- User-friendly web interfaces with visual representations
Online traceroute tools typically provide:
- Web-based interfaces with intuitive design
- Map-based result visualization
- Historical traceroute data storage
- Comparative analysis from multiple vantage points
Result Analysis: How to Analyse Traceroute Results
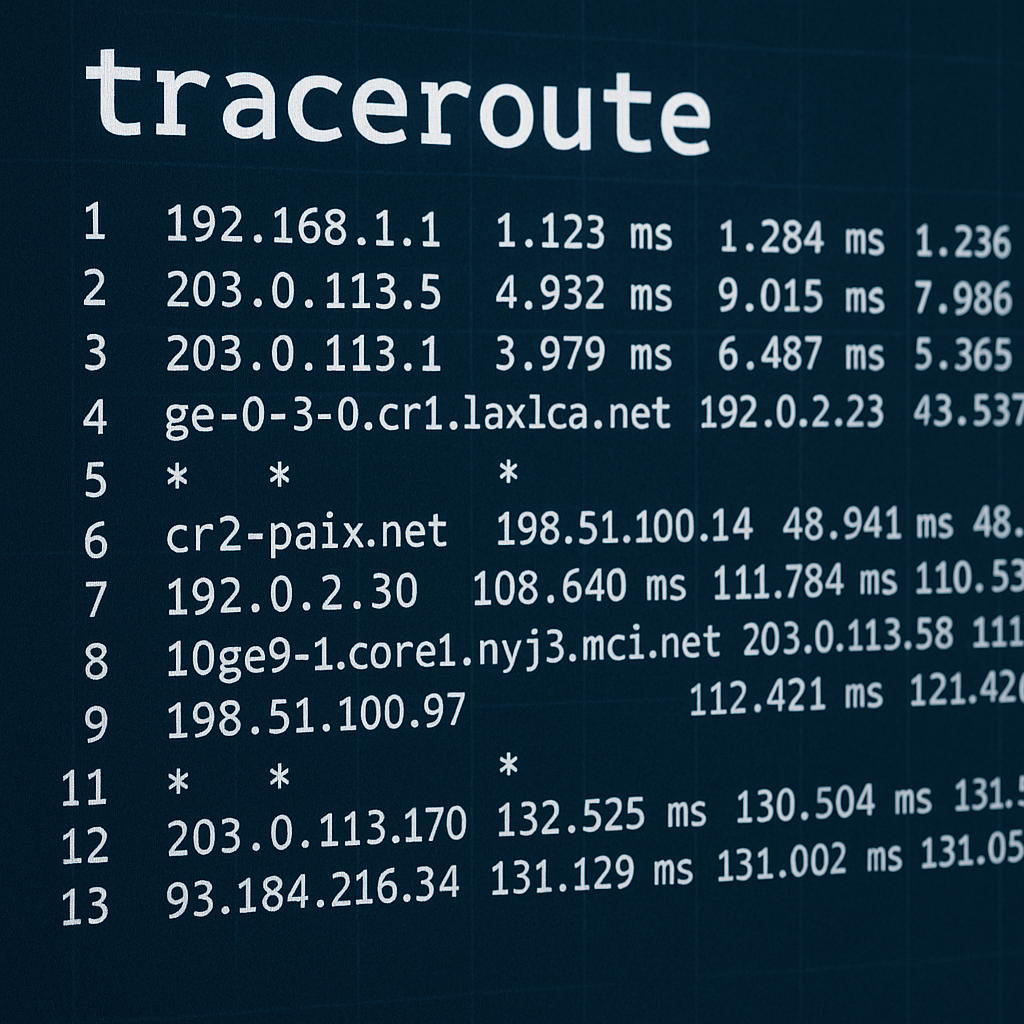
Output Interpretation
Traceroute results typically display:
1  192.168.1.1 (192.168.1.1)  1.234 ms  1.156 ms  1.089 ms
2  10.0.0.1 (10.0.0.1)  15.678 ms  14.234 ms  16.789 ms
Key components:
- Hop Number: Router position in the routing chain
- IP Address: Router’s network interface address
- Response Times: Round-trip time measurements (3 probes)
- Hostname: Reverse DNS lookup results (when available)
Troubleshooting Traceroute Request Timed Out
When encountering traceroute request timed out, possible causes include:
- ICMP Filtering: Routers configured not to respond to ICMP messages
- Rate Limiting: Network equipment implementing ICMP rate limiting
- Asymmetric Routing: Different paths for forward and return traffic
- Network Congestion: High latency or packet loss conditions
Ping vs Traceroute: Technical Comparison
| Feature | Ping | Traceroute |
|---|---|---|
| Purpose | End-to-end connectivity testing | Path discovery and analysis |
| Information | RTT and packet loss statistics | Hop-by-hop latency mapping |
| Protocol | ICMP Echo Request/Reply | ICMP + UDP/TCP (platform-dependent) |
| Output | Aggregated connectivity metrics | Detailed routing information |
| Use Case | Quick connectivity verification | Comprehensive network troubleshooting |
Ping vs traceroute represents complementary rather than competing approaches. Ping answers “can we connect?”, while traceroute reveals “how do we connect?”.
Does Traceroute Use ICMP?
Does traceroute use ICMP? – The answer varies by implementation:
- Windows: Pure ICMP Echo Request approach
- Linux/Unix: Primarily UDP packets with ICMP for error responses
- Advanced Variants: TCP traceroute, SCTP traceroute available
- Modern Tools: Multi-protocol support with user-selectable options
Practical Applications of Traceroute Tool
Network Diagnostics
- Identifying network bottlenecks and congestion points
- Detecting routing loops and suboptimal paths
- Performance analysis of network segments
- Troubleshooting connectivity issues
Security Analysis
- Detecting unauthorized network hops
- Analyzing potential attack vectors
- Firewall configuration verification
- Network topology reconnaissance
Performance Optimization
- Comparing alternative routing paths
- ISP performance evaluation
- Latency analysis and optimization
- Network capacity planning
Advanced Traceroute Techniques
Multi-Protocol Tracing
Modern traceroute tool implementations support:
- UDP Traceroute: Traditional approach with high port numbers
- ICMP Traceroute: Direct ICMP packet usage
- TCP Traceroute: Bypassing firewalls that block UDP/ICMP
IPv6 Traceroute
Next-generation protocol support:
- Command:
traceroute6ortraceroute -6 - Protocol: ICMPv6 instead of ICMPv4
- Addressing: 128-bit IPv6 address display
- Functionality: Equivalent features to IPv4 implementation
Frequently Asked Questions (FAQ)
1. Is traceroute safe to use?
Traceroute is a completely safe passive diagnostic tool. It only sends standard network packets to trace routing paths without interfering with network traffic or modifying routing tables. However, some enterprise firewalls may block ICMP responses due to security policies.
2. Why does traceroute request time out?
Traceroute request timed out occurs due to various technical reasons:
- ICMP Filtering: Routers configured not to respond to ICMP Time Exceeded messages
- Rate Limiting: Network equipment implementing ICMP rate limiting to prevent abuse
- Asymmetric Routing: Return path differs from forward path
- Packet Loss: High network congestion or routing instability
3. What’s the difference between ping vs traceroute?
Ping vs traceroute have fundamental differences:
| Aspect | Ping | Traceroute |
|---|---|---|
| Purpose | End-to-end connectivity test | Path discovery and analysis |
| Information | RTT and packet loss | Hop-by-hop latency mapping |
| Protocol | ICMP Echo Request/Reply | ICMP + UDP/TCP (varies) |
| Output | Aggregated statistics | Detailed route information |
| Use Case | Quick connectivity check | Network troubleshooting |
4. Does traceroute use ICMP?
Does traceroute use ICMP? – Implementation varies by platform:
- Windows: Pure ICMP Echo Request approach
- Linux/Unix: Primarily UDP packets, ICMP for error responses
- Advanced variants: TCP traceroute, SCTP traceroute available
- Modern tools: Multi-protocol support with user-selectable options
5. How to analyze traceroute results?
How to analyse traceroute results requires understanding key metrics:
Response Time Analysis:
- Consistent low latency: Healthy network segment
- Sudden latency spike: Potential bottleneck or routing issue
- Asterisks (*): Timeout or ICMP filtering
- High jitter: Network instability
Geographic Analysis:
- Logical path progression: Packets follow expected geographic route
- Unexpected detours: Potential suboptimal routing
- CDN detection: Traffic routed through content delivery networks
6. Why is Windows traceroute different from Linux traceroute?
Implementation differences:
- Windows (tracert): ICMP Echo Request packets
- Linux: UDP packets with incrementing destination ports
- Protocol handling: Different approaches to probe packet construction
- Output format: Varies in presentation and additional information
7. Does traceroute work with IPv6?
Modern traceroute implementations support IPv6:
- Command:
traceroute6ortraceroute -6 - Protocol: ICMPv6 instead of ICMPv4
- Addressing: 128-bit IPv6 addresses in output
- Features: Equivalent functionality to IPv4 version
8. How to optimize traceroute performance?
Traceroute tool optimization techniques:
- Parallel probing: Multiple simultaneous probes per hop
- Protocol selection: Choose optimal protocol based on network
- Timeout tuning: Adjust timeout values for network conditions
- Packet size optimization: Minimize MTU discovery issues
Best Practices for Network Professionals
Systematic Approach
- Baseline establishment: Regular traceroute measurements for comparison
- Multi-point testing: Trace from multiple source locations
- Time-based analysis: Compare results across different time periods
- Protocol correlation: Combine with other diagnostic tools
For more information, see the official Linux traceroute manual or the Windows tracert command guide.
Documentation and Monitoring
- Route mapping: Document normal routing paths
- Anomaly detection: Identify deviations from baseline behavior
- Performance trending: Track latency changes over time
- Incident correlation: Associate routing changes with network events
Conclusion
Traceroute is a fundamental diagnostic tool in the network engineering arsenal. From traceroute online tools to advanced Linux traceroute implementations, mastering how traceroute works enables effective network troubleshooting and performance optimization. Understanding the nuances of Windows traceroute, traceroute Mac, and handling traceroute request timed out scenarios will significantly enhance network diagnostic capabilities.
Network professionals need to integrate traceroute analysis with other diagnostic tools to build comprehensive network monitoring strategies. Proper traceroute test methodology combined with systematic how to analyse traceroute results approaches will provide deep insights into network behavior and routing efficiency. Whether using command-line tools or traceroute online services, this powerful diagnostic utility remains essential for maintaining robust, high-performance network infrastructure.